Calculation rules - our fair algorithm for tracking results
Added: 09.08.2018
| Edited: 17.09.2025

Most of the Safetrading platform users ask us how we calculate the percentage of profit or loss in the reports. In the beginning, we used to do all of the processes of review manually but now, because of the high increase of channels and bots that want to be checked, we developed our special algorithm and connected it to the AI.
This program takes into consideration all of the important factors - crypto traders' experience, profit, doubtful mentions of the channel, etc.
Now we conduct two parts of review - the first one is made by the Safetrading Algorithm and the second one - by the team of experienced crypto traders who checks the review made by the program to be sure everything is audited in a proper way.
The Main Reasons of Our Trading Reports Are:
- To compare and contrast all operators with a single calculation formula. It means that each brand finds itself in the same conditions while users receive honest and unbiased trading results.
- To show the actual figures of all trading sessions. Some providers fall short of the mark and show white-washed trading results. We aim to demonstrate the actual state of things so that anyone can opt for a gainful and trusted service only.
- To give you the advanced analytics of each trading session and results of applied strategy (underway).
IMPORTANT! Data handling is carried out in real-time mode and is based on paid channels information of each provider. All reports are formed automatically. It means we never edit them manually to keep the trading statistics as originally offered to subscribers. As soon as the data appears in a paid channel, it immediately transfers to our reports.
Components Example

Let's take a closer look at the definitions of each column of the table:
- Coin – trading signal pair.
- Buy Date – the date an asset was purchased (deal opening date).
- Sell Date – the date an asset was sold.
- Open Price – the price of an asset at the time of purchase.
- Target 1/2/3 are the selling prices, while Target 1 is the least profitable and low-risk forecast, and Target 3 is the riskiest and top gainful one. If the Target price is highlighted along the contour, the coin has reached the corresponding price mark.
- Stop Loss - the price at which a crypto trader is recommended to sell the asset with minimal losses. If the indicator is absent in the prediction, the corresponding parameter was not considered when selling a coin.
- Sell Price – the selling price of an asset when the maximum Target price mark is reached.
- Profit/loss (3% of trade) – profit or loss on a closed trade. If the cell value is negative, an asset was sold at a loss expressed as a percentage. We apply 3% (from total amount) of trade investment rule for one trade.
NOTE! Trading reports are presented both for “Spot” and “Futures” signals. The only difference between them is the “Cross” column added for the “Futures” tab. The “Cross” column demonstrates the leverage value used for trading.
Overall Report Calculations
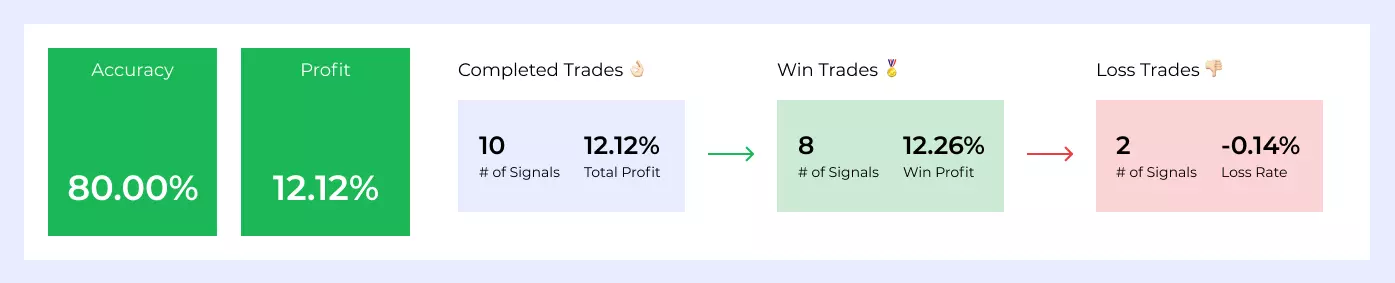
The upper part of the table includes general stats on all completed trades with a real-time update feature. It involves the following sections:
- Accuracy - is the average percentage ratio of profitable signals to the failed ones during the last six months.
- Profit - the average profit ratio based on signals provided for the last six months.
- Completed Trades - includes the number of trading signals and profit expressed as a percentage.
- Win Trades - shows the number of successful predictions and the win profit expressed as a percentage.
- Loss Trades - demonstrates the number of dampened forecasts along with the loss rate expressed as a percentage.
Process of Review
Keep in mind that the profit value is indicated considering the conservative approach of investing in digital assets – no more than 3% of the deposit for one position.
If a crypto trader invests 10% – using a more edge-walking strategy, the profit results indicated in the table may be three times higher.
Types of Results You May Witness
Here are 5 types of results that might be indicated in the report table.
#1 The Price Reached All 3 Targets
Let's analyze the first crypto pair, namely LSKUSDT:

The coin was purchased at 2,2 on July 27, 2021. The provider offered three possible sales prices:
- Target 1 - 3.130
- Target 2 - 3.700
- Target 3 - 4.500
Meanwhile, the Stop Loss parameter was set at 1.99. Finally, the asset was sold at Target 3 price on July 14, 2021. The profit on this deal was 3.14% (of the deposit amount).
#2 The Price Reached One Target Only
Here’s an example:

The asset was bought at 1.37 on May 17, 2021. After the price hit Target 1 it moved further and reached Target 2. The provider sold the coin at 1.68 on May 18, 2021. The profit was 0.68%.
#3 Sold Following the Stop Loss
Let's check another example with the ICPUSDT signal:

The coin was purchased at 42.0 on July 7, 2021. The provider offered three target selling prices:
- Target 1 - 53.000
- Target 3 - 59.000
- Target 3 - 70.000
The Stop Loss parameter was set at 39.0. The asset failed to reach the expected price values. It was sold as soon as the price touched the corresponding Stop Loss mark. The loss on this transaction amounted to -0.21% (of the deposit amount).
#4 Failed Buying Case

It means, the provider didn’t manage to buy the coin at the recommended price. That’s why there’s no profit/loss result added.
#5 The Coin is Still on The Run

Sometimes you may witness that the table does not contain the Target prices or Stop Loss parameter - only the “Buy Date.” It means that the coin is in active trading phase, and the results will be added right after the asset is sold.
Final Thoughts
The benefits of our methodology are apparent to both novice and seasoned crypto traders. Our team analyzes statistics and data of trading sessions for each forecast daily. Thus, crypto traders receive clear and unbiased analytics, which shows how gainful a provider's calls really are.
Note that the "Profit" cell data is indicated, taking into account a very conservative approach to investing. We are talking about a risk management strategy involving investing no more than 3% of the deposit amount for one transaction.
If you are an experienced crypto trader, you can invest large sums in the purchase of an asset. This way, you can generate higher profits, but the risk of loss must also be considered.


